The not-so-short tutorial for study ERPs (using EEGLAB custom scripting in MATLAB)
This post is for people who want to do ERP experiments (or are already doing it) but never started using EEGLAB custom scripts. Based on the official tutorial and a minimalist approach, we will see how to do it.

What is an ERP?
In electroencephalography (EEG), an event-related potential (ERP) it is a brain response that have an stable time relationship with a reference event (it can be motor, cognitive or sensory). It is a technique really useful in Cognitive Neuroscience dating back to 1939 when Pauline and Hallowell Davis publish the first ERP recordings (without using computers!) from awake humans .
Briefly, an ERP it is aquaired by repeatedly presenting the event of interest (for example, an image) and averaging the multiple signals time-locked by the presentation of the stimulus, one can obtain a positive or negative fluctuation caused by the event presented.
Why would you want to use it?
Because the raw EEG data it is product of a huge amount of neural sources, we need to use methods that can relate some characteristics of the signal with a stimulus of interest for our research question. You want to ask a scientific question that relate some type of sound, image or other stimulus with a brain response? Maybe ERPs can be your option!
EEGLAB
EEGLAB is an open source signal processing environment for electrophysiological signals running on Matlab. It allows you make analysis of EEG, MEG and other electrophysiological data. Despite having a good Graphical User Interface (GUI), know how to use the custom EEGLAB scripting can be a great choice in the long term. It will help you with automation and fine-tuning of every step and can provide fastest and realiable results, particularly to process multiple datasets or the same dataset in different ways.

You need to know some MATLAB code to make it, but really worth it.
The dataset
We will use the sample dataset that comes with EEGLAB, should come with the toolbox, but you can get it here.
The data was obtained from the experiment of Makeig et. al., 1999 and the EEGLAB tutorial says the follow about:
[In this experiment, there were two types of events “square” and “rt”, “square” events corresponding to the appearance of a green colored square in the display and rt to the reaction time of the subject.
The square could be presented at five locations on the screen distributed along the horizontal axis. Here we only considered presentation on the left, i.e. position 1 and 2 as indicated by the “position” field (at about 3 degree and 1.5 degree of visual angle respectively).
In this experiment, the subject covertly attended to the selected location on the computer screen responded with a quick thumb button press only when a square was presented at this location. They were to ignore circles presented either at the attended location or at an unattended location. To reduce the amount of data required to download and process, this dataset contains only targets (i.e., “square”) stimuli presented at the two left-visual-field attended locations for a single subject].
And also it is important important to know that:
[…the sample data file contains “faked” continuous EEG data. To reduce (your) download time, this “pseudo-continuous” EEG dataset was actually constructed by concatenating eighty separate three-second data epochs (which we will later separate again)].
Let’s code!
Once you have installed MATLAB (or his alternative free version, OCTAVE, in which case reading this may help you), you can download EEGLAB from the webpage or GitHub.
We will use the EEGLAB official tutorial in order to achive our learning objetive, going step by step.
Step 0. Basic Matlab bricks to make the castle.
To understand what we are doing, it is necessary to know what the main Matlab structures of EEGLAB are:
- EEG: The current EEG dataset and the principal structure. Contains all the information about the current EEGLAB dataset.
- ALLEEG: Array of all loaded EEG datasets. It is a structure array of EEG datasets.
- CURRENTSET: The index of the current dataset.
- LASTCOM: The last command issued from the EEGLAB menu
- ALLCOM: All the commands issued from the EEGLAB menu
TIP: The authors recommend the use of eegh command in order to see the scripting result of your GUI actions.
Step 1. Open EEGLAB
First, you need to go to the path of EEGLAB replacing ‘/home/Matlab/eeglab/’ for the appropriate in your computer :
% Evetything after symbol "%" will be ignored by the Matlab %interpreter.addpath(genpath('/home/Matlab/eeglab/'))
And then you can open it:
%Open EEGLAB
[ALLEEG, EEG, CURRENTSET, ALLCOM] = eeglab;
Step 2. Load the dataset
%Load eeglab_data.set and store in the EEG structure. You can type EEG in the command line to see the fields it contains.EEG = pop_loadset('eeglab_data.set', '/home/Matlab/eeglab/sample_data/');
It is a good moment to say that “pop_” functions (and also “eeg_”) are really important in EEGLAB. They are like an intermediate step between the GUI and the scripting. For example: If you run in the command line “pop_loadset()” without parameters, an interactive window will appear where you can put the necesary parameters to perform the required action (in this case, search for the dataset file in your computer).
Step 3. Load the channel location file
EEGLAB needs to know the position of the electrodes used in the experiment. This depends, of course, on the type of device used for data acquisition. Typically, the company that produces the equipment provides a file with the coordinates of the electrodes on the scalp.
Here we use the autodetect parameter for the file type. Normally works well, but you can change it for the file extension if you need it.
EEG.chanlocs=pop_chanedit(EEG.chanlocs, 'load' {'/home/Matlab/eeglab/script/eeglab_chan32.locs', 'filetype', 'autodetect'}); Step 4. Store the dataset into EEG structure
What is more important that keep secure our data? Let’s store it:
[ALLEEG, EEG, CURRENTSET ] = eeg_store(ALLEEG, EEG);TIP: You can use pop_eegplot() with the parameter ‘EEG’ for visualization of the signal at any moment of your analysis.

Step 5. Filtering
Filtering the EEG signal to remove artifacts is a common pre-processing step and you can do it this way:
%High pass filter the data with cutoff frequency of 1 Hz.
EEG = pop_eegfilt( EEG, 1, 0, [], [0])
%Where,
% low_cutoff = 1
% hi_cutoff = 0
Note: pop_eegfilt() uses linear finite impulse response (FIR) filtering.
A good practice is to make a new one everytime you make a change over the entire dataset. In this case, after filtering we will create a new dataset
% New dataset with the name 'filtered Continuous EEG Data'
% Now CURRENTSET= 2[ALLEEG, EEG, CURRENTSET] = pop_newset(ALLEEG, EEG, CURRENTSET, 'setname', 'filtered Continuous EEG Data');
Optional: Re-referencce the data:
% Re-refrence the new dataset
EEG = pop_reref( EEG, [], ‘refstate’,0);
Step 6. Extract epochs
We need to extract data epochs time locked to our events of interest (in this case, the presentation of squares) in order to study ERPs.
We can do it with the function pop_epoch(), which convert a continuous EEG dataset to epoched data by extracting data epochs time locked to specified event types or indices. This means that will grab a window of time around each of our events of interest, and concatenate all these windows.
% Extract epochs time locked to the event ‘square’, from 1 second before to 2 seconds after those time-locking events.EEG = pop_epoch( EEG, { ‘square’ }, [-1 2], ‘newname’, ‘Continuous EEG Data epochs’, ‘epochinfo’, ‘yes’);
Step 7. Remove baseline
pop_rmbase() remove channel baseline means from an epoched or
continuous EEG dataset.
%Remove baseline
EEG = pop_rmbase( EEG, [-1000 0]);
We use the point range ‘[-1000, 0]’, but empty or ‘[]’ input will use whole epoch as a baseline.
Step 8. Calculate ICA Components
Independent component analysis (ICA) is a statistical and computational technique for revealing hidden factors that underlie sets of random variables or signals. Usually this is a common step in EEG signal processing in order to reject artifacts:
%Run an ICA decomposition of an EEG dataset using runica.EEG = pop_runica(EEG, 'extended',1,'interupt','on');
For this processing we don´t want to remove any component, but if you want to do it can read it here and here.
TIP: If you want to change with the GUI, it is important to type the command “redraw” to update the changes in the window:
% Update the EEGLAB window to view changes
eeglab redraw
Step 9. Plot ERPs
EEGLAB has several ways to plot ERPs. To keep it simple I go to show you two of them, but depending on your needs, you maybe need to do another. In all of them we need to make some type of data averaging.
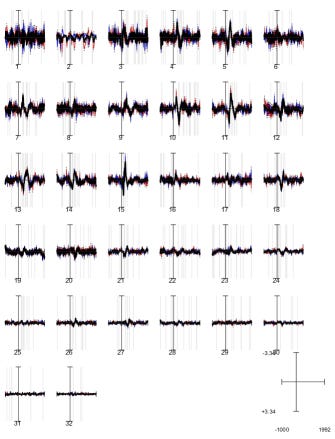
We can plot ERPs in a 2-D topographic map, that means that you can display concatenated multichannel data epochs in a topographic array format with pop_plottopo() function . The electrode arrangement respect the positions of channel locations and you can press in any of them to make a single electrode plot:
pop_plottopo(EEG)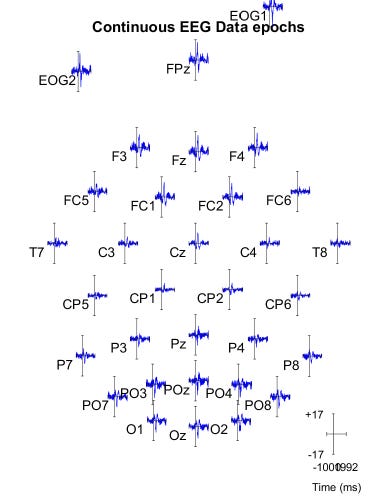
Another common way to study ERPs is to compare between two conditions. This need two things:
- Select the events of interest and store them separately. Based in the EEGLAB official tutorial, we will study two of the four positions of the squares the experiment of the example dataset:
%Selecting events for squares in position 1.
EEG = pop_selectevent( EEG, 'position',1,'deleteevents','off','deleteepochs','on','invertepochs','off');[ALLEEG, EEG, CURRENTSET] = pop_newset(ALLEEG, EEG, 2,'setname','Square, Pos. 1','gui','off');EEG = eeg_checkset( EEG );%Selecting events for squares in position 2.
EEG = pop_selectevent( EEG, 'position',2,'deleteevents','off','deleteepochs','on','invertepochs','off');[ALLEEG, EEG, CURRENTSET] = pop_newset(ALLEEG, EEG, 2,'setname','Square, Pos. 2','gui','off');EEG = eeg_checkset( EEG );
2. Computing Grand Mean ERPs
%Compute the grand average ERP waveforms of multiple datasets %currently loaded into EEGLAB, with optional ERP difference-wave %plotting and t-tests.[erp1 erp2 erpsub time sig] = pop_comperp( ALLEEG, 0, [3 4] ,[],'addavg','on','addstd','on','addall','on','subavg','on','diffavg','on','diffstd','off','alpha',0.05,'tplotopt',{'ydir' -1});% Output:
%     erp1   - Grand average (or rms) of the 'datadd' datasets
%     erp2   - Grand average (or rms) of the 'datsub' datasets
%     erpsub - Grand average (or rms) 'datadd' minus 'datsub'
%              difference.
%     times  - Vector of epoch time indices
%     sig    - T-test significance values (chans,times).
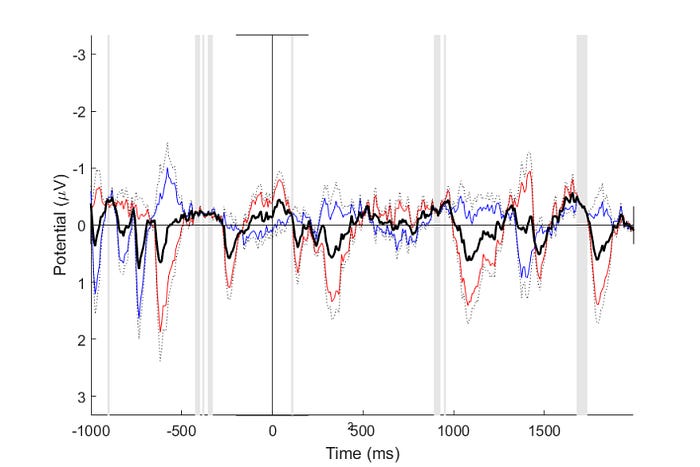
Blue curve — ERP elicited by ‘squares in position 1’
Red curve — ERP elicited by ‘squares in position 2’
Continuous black curve — Grand average ERP for the two conditions.
Dotted black curve — Standard deviation of the two ERPs.
After doing the two-tailed t-test at each time point, the gray shading indicates where there are statistically significant differences (α = 0.05. Uncorrected for multiple comparisons).
Conclusion
Finally, the objective of the above is not to cover the subject exhaustively, but to show that EEGLAB is a powerful tool for studying brain dynamics. The main idea is to encourage non-programmer professionals (like me) to use computer code to analyze neuroscience data.
References
- EEGLAB: https://sccn.ucsd.edu/eeglab
- Delorme, A., & Makeig, S. (2004). EEGLAB: an open source toolbox for analysis of single-trial EEG dynamics including independent component analysis. Journal of neuroscience methods, 134(1), 9–21.
- Makeig, S., Westerfield, M., Jung, T. P., Covington, J., Townsend, J., Sejnowski, T. J., & Courchesne, E. (1999). Functionally independent components of the late positive event-related potential during visual spatial attention. Journal of Neuroscience, 19(7), 2665–2680.
